Precious Metals 2nd-Quarter 2018 Review And The Outlook For Q3 2018 – ETFS Physical Precious Metal Basket Trust ETF (NYSEARCA:GLTR)
The precious metals sector of the commodities market posted an overall loss in the second quarter of 2018.
The composite of the four precious metals that trade on the COMEX and NYMEX divisions of the CME dropped by 8.10% in 2014. The sector fell by 19.46% in 2015, but in 2016, precious metals gained 11.71 %. Precious metals moved 20.19% higher in 2017 posting its second consecutive annual gain. In Q2 2018, the sector moved 3.37% lower in a corrective move led by losses in platinum and gold. The sector declined as the US dollar index gained almost 5% over the three-month period.
The U.S. Federal Reserve added another rate hike to their agenda for 2018 bringing the total to four or 1%. The short-term rate in the U.S. will likely be at the 2.25%-2.50% level at the end of 2018. The Fed, at their June meeting, told markets to expect two more hikes in 2018. The new Chairman of the Fed, Jerome Powell, appears more hawkish than his predecessor when it comes to monetary policy.
The program to reduce the Fed’s swollen balance sheet which is a legacy of the quantitative easing program continues to tighten credit in longer-term government debt maturities. Higher rates tend to weigh on the prices of commodities like precious metals. In Q2, all precious metals made new lows for 2018.
Meanwhile, global interest rates continue to be at very low levels- in Europe, and Japan rates are negative. However, the ECB told markets that their QE program would end at the end of 2018. The widening gap between U.S. rates and other currency yields caused a recovery in the dollar which weighed on precious metals prices.
The geopolitical landscape calmed in Asia during Q2. The summit between President Trump and North Korean leader Kim Jong Un set the stage for denuclearization of the hermit nation which decreased tensions on the Korean Peninsula.
The Middle East continues to be a potential tinderbox that could flare up at any time without notice. The tensions between Saudi Arabia and Iran continues to be a concern in the region. While U.S. and European relations with Russia remain strained, President Trump and Russian leader Vladimir Putin will hold a summit in Helsinki, Finland in July.
The most significant issue when it comes to markets across all asset classes in Q2 has been the Trump Administration’s move to level the playing field in international trade. Tariffs and retaliation with trading partners around the world have distorted prices in many markets.
The spectacular rise in digital currencies over the course of 2017 came to an end in Q1 and Q2 as Bitcoin, and other cryptocurrencies declined precipitously. The total market cap of the digital currency market declined from over $800 billion in December 2017 to under $260 billion at the end of Q1. At the end of Q2, the market cap moved even lower to just under $236 billion with Bitcoin moving below the $6000 level. Bitcoin had traded at over $19,000 in the final month of 2017, so the price at the end of the first half of 2018 was less than one-third the price at the high.
Precious metals are limping into the third quarter and second half of 2018. Gold has declined to a level that threatens the pattern of higher lows that has been in place since December 2015.
Gold Review
Gold fell 10.46% in 2015, but it rallied by 8.66% in 2016. The yellow metal posted a 13.65% gain in 2017. Gold settled on June 29, 2018, at $1254.50 per ounce basis the active month COMEX August futures contract, $68.30 or 5.16% lower for the second quarter. Gold moved 4.19% lower in the first half of 2018. Gold traded in a range between $1246.90 and $1365.40 over the first six months of this year with the highs coming in late January and early April on the continuous contract making a double top in the gold market in 2018. The lows for the year came during the final week of Q2 as the price slipped on the back of trade issue and a stronger U.S. dollar. The GDX closed Q1 2018 at $21.98 and Q2 at $22.34, up 1.6% for the three-month period. The GDXJ moved from $32.15 at the end of Q1 to $32.69 at the close of Q2 moving 1.7% higher. Gold stocks outperformed the yellow metal over Q2. 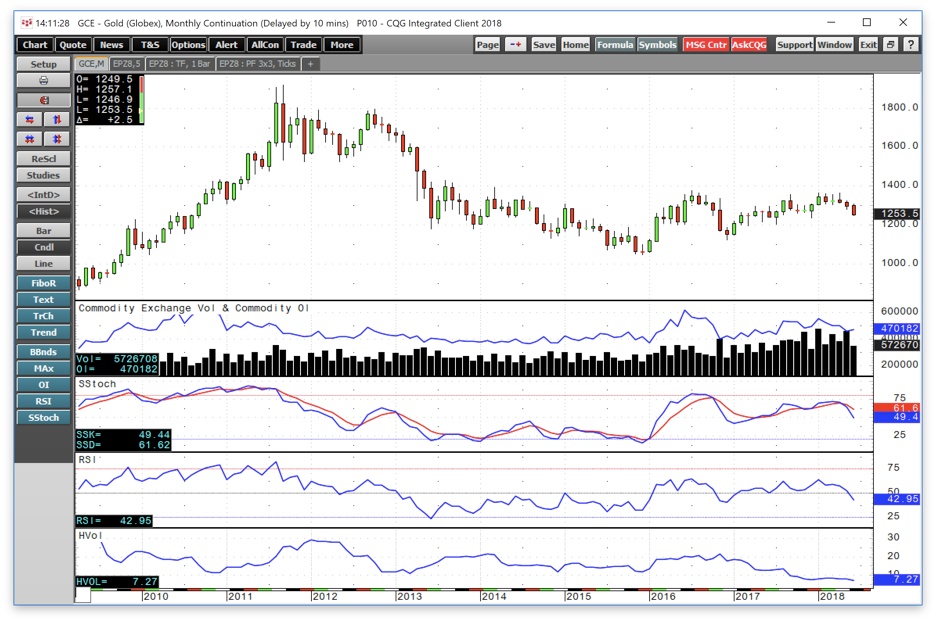
Source: CQG
As the monthly chart of COMEX gold futures highlights, price momentum in the yellow metal crossed to the downside in neutral territory which now threatened the bullish trade that has been in place since December 2015.Gold put in a bullish key reversal pattern on the monthly chart in December 2017 on low volume, but the price moved higher in Q1 of 2018 which was a follow through of the technical pattern. However, after two attempts to challenge the 2016 peak at $1377.50, the yellow metal put in a double top at $1364.50 in late January and early April which led to a lower low for 2018. Nearby August gold futures traded to a low of $1246.90 on the final day of trading for Q2 and critical technical support stands at the December 2017 bottom at $1236.50 per ounce. If gold moves below that level, it would negate the pattern of higher lows that has been in place on the medium and longer-term charts since December 2015. 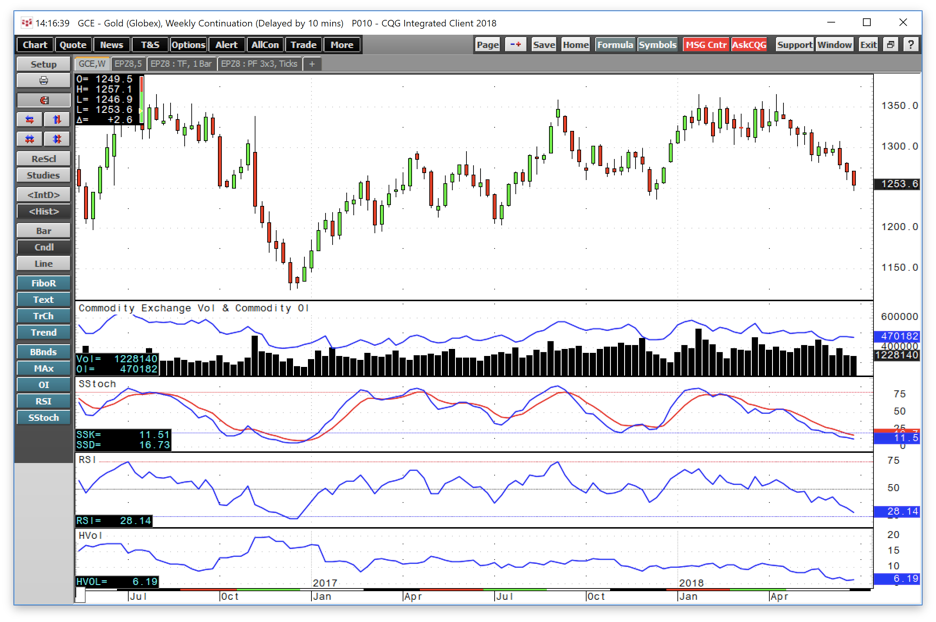
Source: CQG
The weekly chart illustrates that gold ended the first half of 2018 at lows. Price momentum has declined into deeply oversold territory after the recent move that took gold $118.50 lower from the highs during early April. Support on the weekly chart is at $1236.50 per ounce level with resistance at $1365.40 as we head into Q3.
Gold is limping into the third quarter of the year as the yellow metal traded just $10.40 above its critical support level on the final day of the second quarter. The recovery in the dollar has weighed on the price of gold and many other commodities. Additionally, the threat of a risk-off period over trade issues has been bearish for the price of the precious metal. A more hawkish Fed has also contributed to losses in the price of metal that is a barometer for fear and uncertainty in markets. While gold looks like it will test, and perhaps fall below its critical level of technical support at the December 2017 low, it is important to remember that gold typically looks its worst on lows and best on highs.
Silver Review
Silver was the best performing precious metal in 2016. Silver was up 15.63% in 2016 after moving 11.51% lower in 2015. In 2014, silver shed 22.82% of its value. In 2017, the price of silver moved 7.42% higher. Silver settled on June 29 at $16.1040 per ounce on the nearby month July COMEX futures contract and was just 1.01% lower in Q2. Silver lost 6.07% of its value over the first six months of this year. Silver outperformed gold in Q2, but over the first six months of the year, silver has lost most on a percentage basis than the yellow metal. Silver traded in a range between $15.88 and $17.705 during the first half of the year with the high coming on January 25 and the low on June 28.
Silver tends to magnify moves in the gold market, but the first half of 2018 was a quiet time for the silver market with few surprises. However, silver made lower highs throughout the first half of 2018 which is a continuation of the trading pattern dating back two years.
As we move into forward into Q3, I will continue to watch the silver-gold ratio, which closed 2016 at 72.18 and moved to 76.37 at the end of 2017. The ratio had moved higher in Q1 to 81.31, 4.94 higher for the quarter, but in Q2 the metric closed at 77.90, 3.41 lower. When the ratio moves to the lower, it tends to be a bullish sign for the precious metals sector on a historical basis.
Like gold, silver closed Q2 close to lows, with the lowest price for 2018 coming on the day before the final trading session in June. Silver looks ugly and like it is preparing to move appreciably lower, which could be the best reason to buy the metal these days.
Platinum Review
Platinum has been a laggard in the precious metals sector for years, and the bearish trend continued in Q2. Nearby platinum futures closed on June 29, at $852.40 per ounce. Platinum lost 26.24% of its value in 2015 after being down 14.35% in 2014. In 2016, platinum only gained 1.58%. Platinum moved 3.59% higher in 2017. In Q1, the metal lost 1.17% of its value over the three-month period, but in Q2 it dropped 8.08%. Platinum traded in a range between $852.40 and $1022.60 so far in 2018 and closed the quarter at close to its lowest level since early 2016 after losing $74.90 per ounce over the past three months.
The platinum-gold spread closed 2015 at a $168.50 discount; platinum was cheaper than gold. The long-term median level for this relationship over the past four decades had been around a $100-$200 premium for platinum over the price of gold. The premium reflects the rarity of platinum; there is more than ten times the amount of gold produced each year than platinum, and on a per ounce basis, industrial applications for platinum are much more than for gold. This relationship closed at a $246.20 discount at the end of 2016. In 2017, it closed at a $371.00 discount to the price of gold. The relationship continued to diverge from the mean in Q1 and closed at $395.50. In Q2, the spread moved another $6.60 away from its historical norm and closed at the $402.10 level. 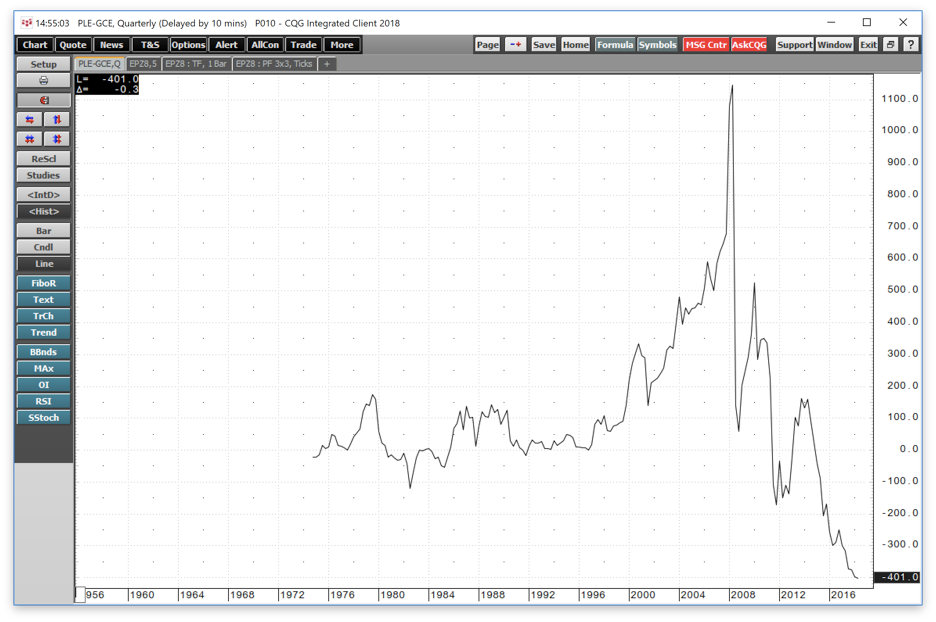
Source: CQG
As the quarterly chart of the price of platinum minus the price of gold reveals before 2015 platinum had never traded to a discount of over $200 to the price of gold. In 2008, it sold at over a $1200 premium. The nickname for platinum is “rich man’s gold” – in recent years it has been anything but that, platinum has not traded at a premium to gold since 2014. In 2015, 2016, 2017, and through the first six months of 2018 platinum has been the cheaper alternative when compared to the yellow metal as the trend in the spread has sent it into a bearish abyss and bottomless pit.
Platinum has been cheap against gold, and in the second quarter of 2018, things got marginally worse for the price spread. At the same time, platinum underperformed palladium over the three-month period making platinum the dog of the precious metals sector.
Palladium Review
Palladium was the best performing precious metal in 2016 posting a gain of 20.96% for the year. Palladium fell 29.61% in 2015 making it the worst-performing precious metal of that year. Palladium fell to lows of $451.50 per ounce in January 2016. Palladium moved an incredible 56.08% higher in 2017 making it the best performing commodity across all sectors for the year. During the first days of Q1 palladium rose to an all-time high at $1133 per ounce surpassing its 2001 peak price at $1090. Palladium traded in a range between $890.85 and $1133.00 during the first six months of this year and closed on June 29 at the $950.90 per ounce. Palladium was the best performing precious metal over Q2 posting a 0.75% gain for the period. 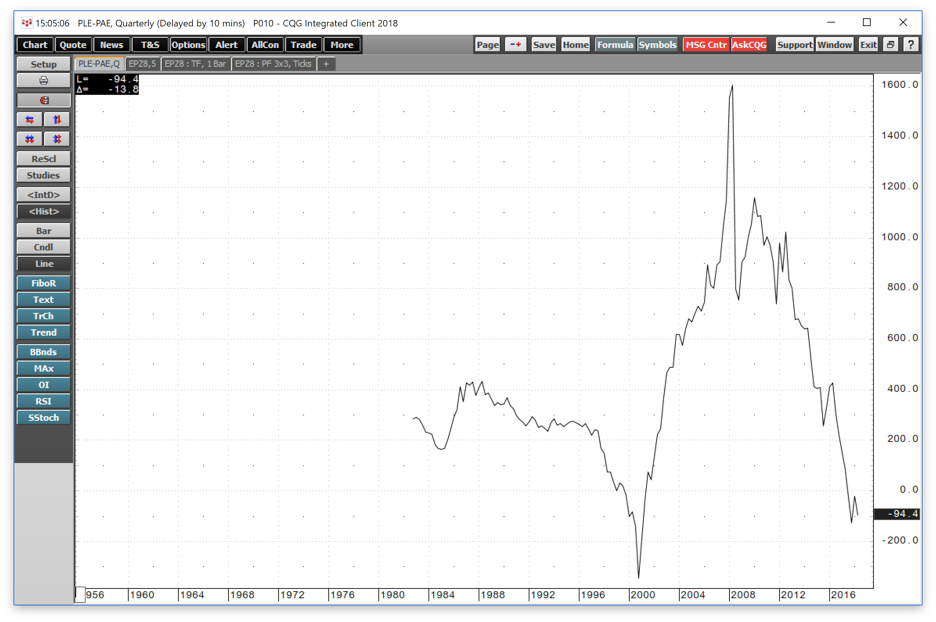
Source: CQG
As the quarterly chart highlights, the all-time high in palladium over platinum came in 2001 when palladium traded to its record peak at $1090 per ounce. The spread peaked at a $344.20 premium for palladium over platinum. However, from 2003 through 2014, platinum traded at more than a $500 premium to palladium which encouraged industrial consumers to use palladium for their requirements. The spread between the two platinum group metals closed 2017 at a $122.70 spread where platinum was lower than palladium. Over the course of Q1, the premium declined and closed Q1 at the $16.50 per ounce level premium for palladium over platinum. However, in Q2 the weakness in platinum caused the spread to go the other way again as it closed on June 29 at a $98.50 premium for palladium over platinum. The spread moved $82 in favor of palladium on a quarter-by-quarter basis.
Palladium did not move lower in Q2, but the price was closer to the lows of the year than the highs on June 29, 2018.
Looking forward to Q3 in the precious metals
Precious metals added to losses from Q1 in Q2. Gold, silver, and platinum finished the first half of 2018 at levels that put the metals on very shaky ground going into the Q3.
Meanwhile, the evaporation of capital in the digital currency market over the first six months of 2018 could be a sign that the move to highs in late 2017 was a bubble in the new asset class.
In Q2, the losses continued in Bitcoin which lost 12.21% of its value and has declined by 59.36% over the first half of the year. The market cap of the entire digital currency market which comprises almost 1600 tokens dropped from $255.3 billion at the end of Q1 to $235.9 billion at the end of Q2 2018. The market cap had peaked at over $800 billion last December.
I am going into the third quarter with a very cautious opinion of the precious metals sector. I have been trading precious metals since the early 1980s and ran the precious metals business of a major Wall Street firm and international bullion dealer in the early 1990s. It has been my experience that when these markets look their ugliest is the time when risk-reward favors long positions.
Precious metals moved lower in Q2, and they closed at levels where the odds of highly volatile conditions have increased dramatically. While I may do some light buying early in Q3, I will be watching the price action and the news cycle which will give me clues about the path of least resistance for prices over the coming three months.
The GLTR is an ETF that represents a basket of the four precious metals that trade on the COMEX and NYMEX divisions of the CME.
A complete, robust review and outlook for the precious metals sector is published for subscribers to The Hecht Commodities Report and is available on Seeking Alpha’s Marketplace.
Any investment involves substantial risks, including, but not limited to, pricing volatility, inadequate liquidity, and the potential complete loss of principal. This document does not in any way constitute an offer or solicitation of an offer to buy or sell any investment, security, or commodity discussed herein, or any security in any jurisdiction in which such an offer would be unlawful under the securities laws of such jurisdiction.
The Hecht Commodity Report is a must-read…
I believe we’re on the verge of a commodities super cycle. Do you know how to profit from it? I do, and I can help you navigate the turbulent commodities markets to make the most of the trends behind the trade. The Hecht Commodity Report on Marketplace provides subscribers with my weekly outlook, top picks, and bullish, bearish or neutral calls on over 30 individual commodities markets, including U.S. futures. I also make timely recommendations for risk positions in ETF and ETN markets and commodity equities and related options. There’s also an active live chat, where I reply quickly to questions. If you want to build wealth with commodities, the Hecht Commodity Report is required reading.
Disclosure: I/we have no positions in any stocks mentioned, and no plans to initiate any positions within the next 72 hours.
I wrote this article myself, and it expresses my own opinions. I am not receiving compensation for it (other than from Seeking Alpha). I have no business relationship with any company whose stock is mentioned in this article.
Additional disclosure: The author always has positions in commodities markets in futures, options, ETF/ETN products, and commodity equities. These long and short positions tend to change on an intraday basis.
Original Source